Overview
5X Business Intelligence delivers powerful self-service analytics capabilities that enable your team to create interactive dashboards, build compelling visualizations, and explore data insights without technical barriers. Enhanced with 5X’s integrated platform features, it provides everything you need to transform raw data into actionable business insights.Powered by Apache Superset5X Business Intelligence is built on Apache Superset, the leading open-source business intelligence platform. We’ve enhanced it with 5X-specific integrations and streamlined the experience for our integrated data platform ecosystem.
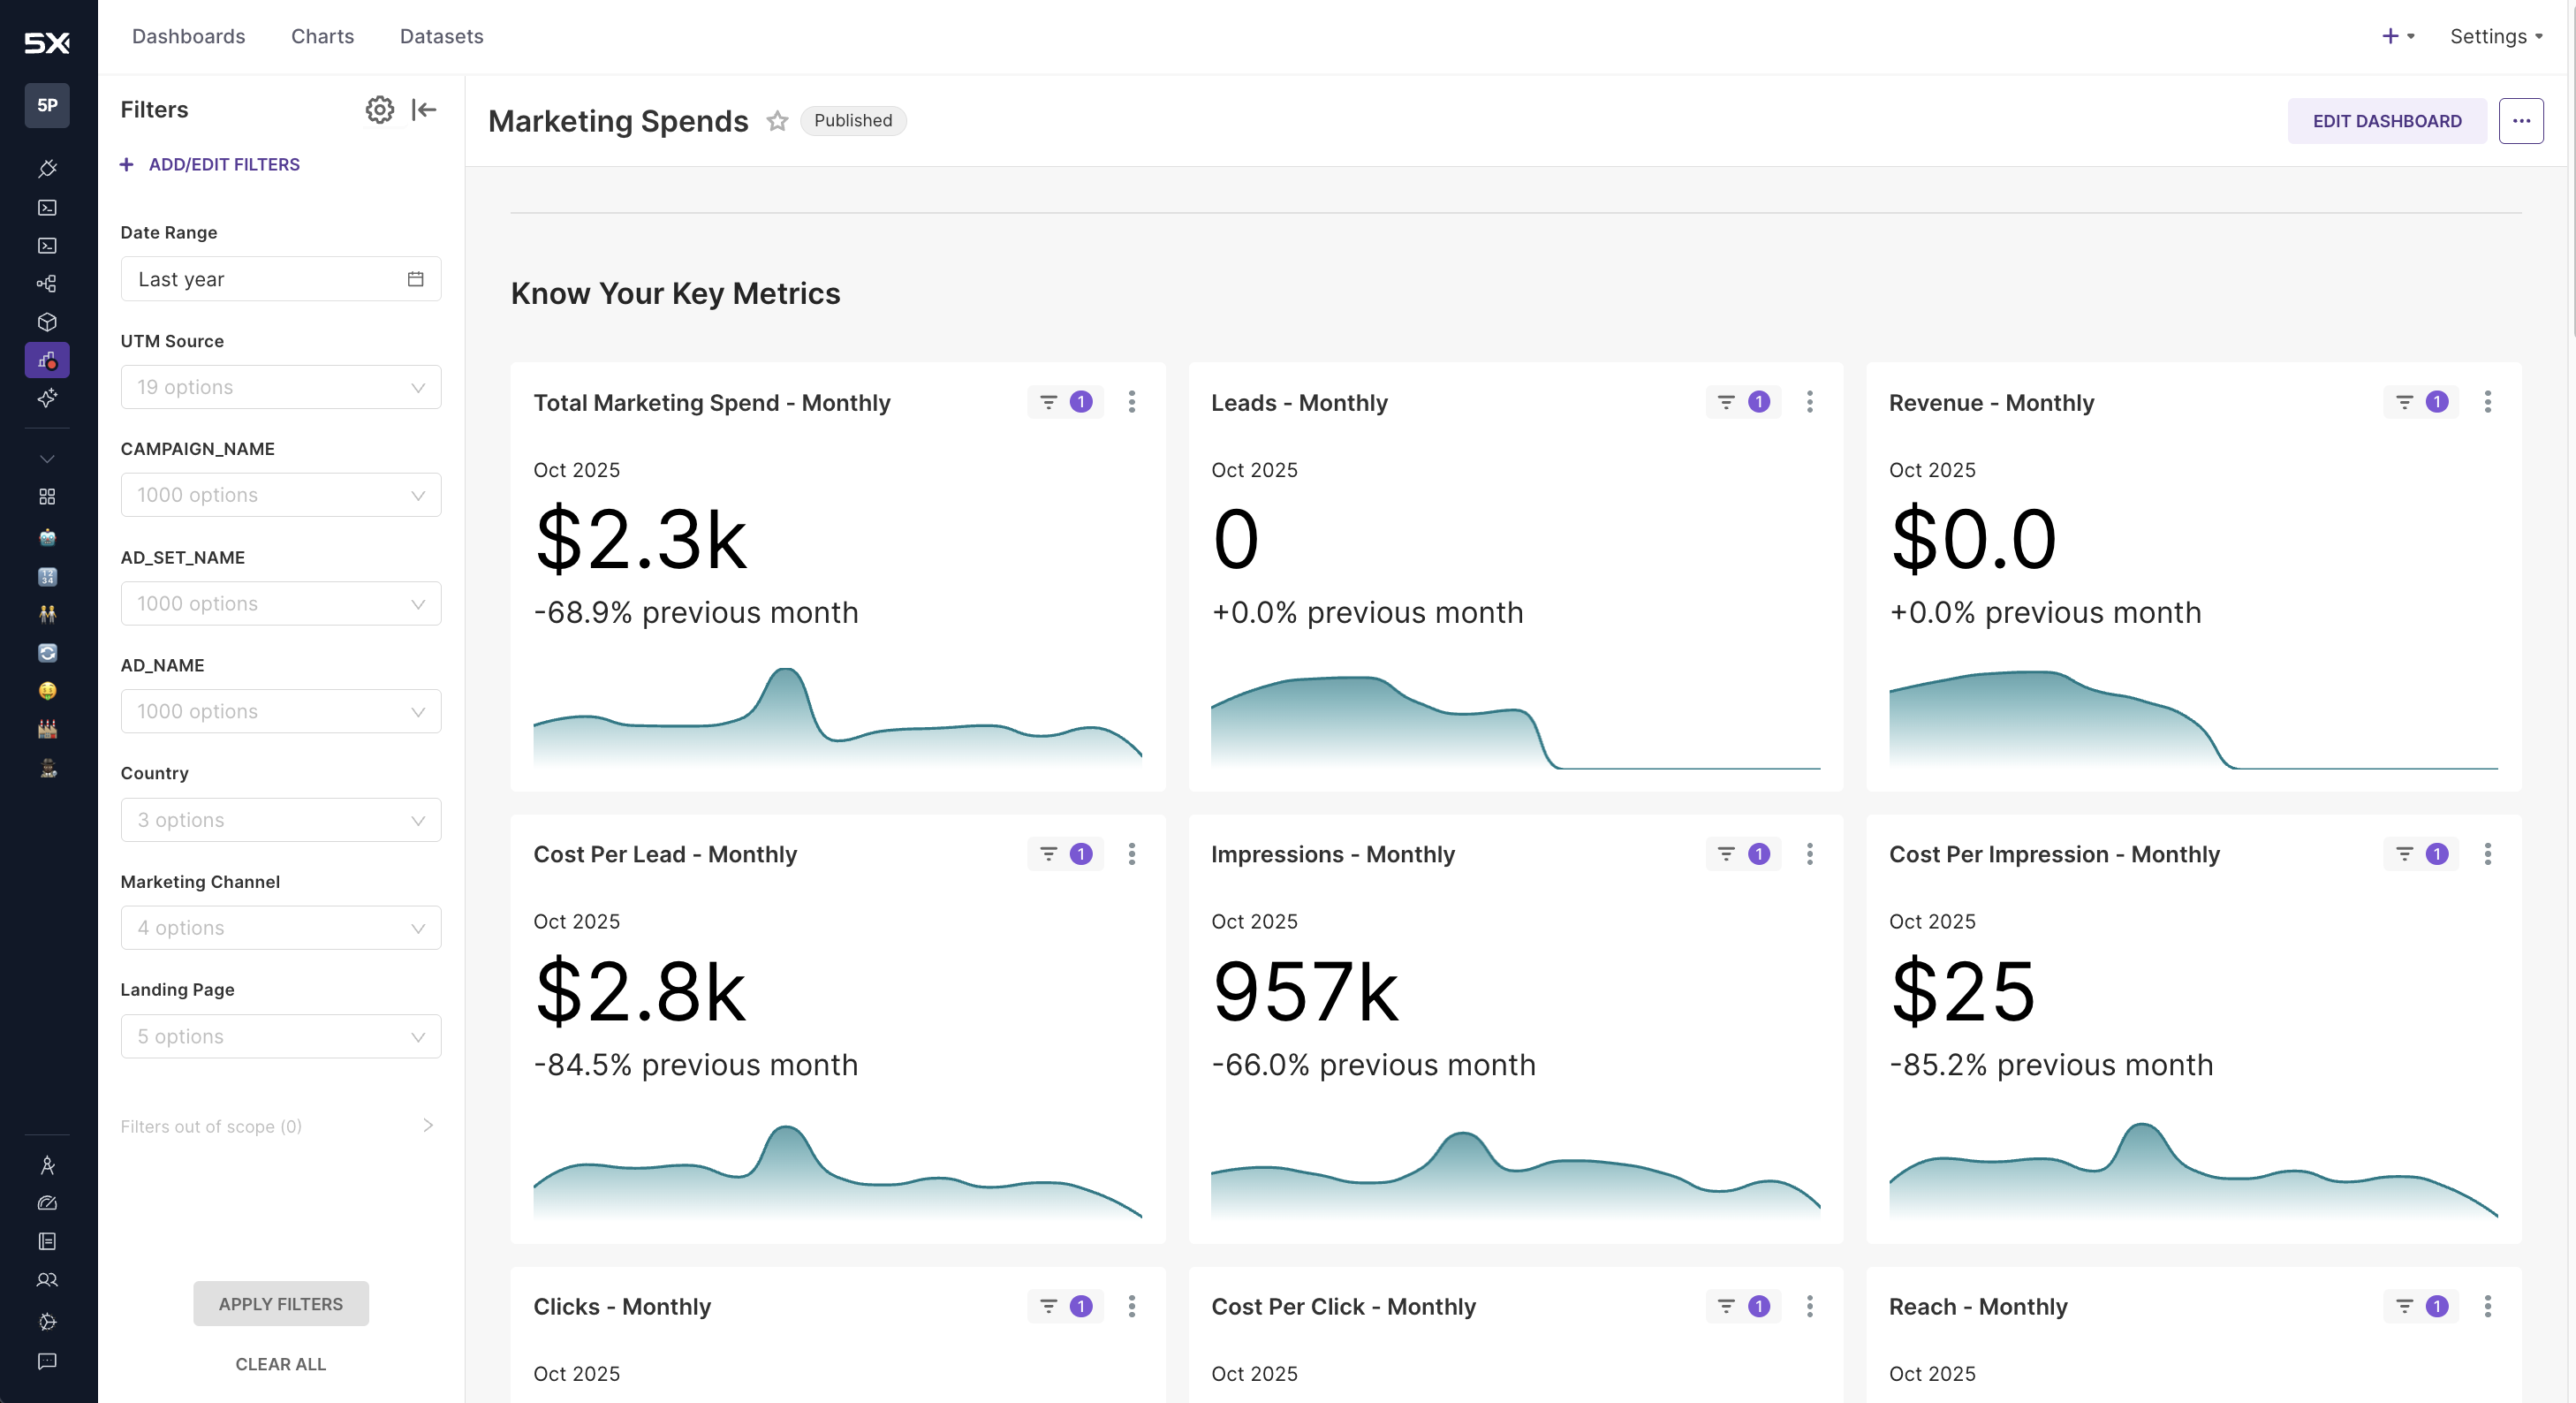
Key capabilities
Interactive dashboard creation
- Drag-and-drop interface for building compelling dashboards
- Rich visualization library with 50+ chart types
- Real-time data updates with automatic refresh capabilities
- Responsive design that works across all devices
- Collaborative features for team-based dashboard development
Self-service analytics
- No-code chart building for business users
- Intuitive data exploration with guided workflows
- Custom SQL support for advanced users
- Data profiling to understand data quality and structure
- Cross-filtering and interactive drill-down capabilities
Integrated data connectivity
- App Connections integration - Connect to your data warehouse seamlessly
- Semantic Layer support - Access unified business metrics
- Real-time data access - Query your warehouse directly
- Multiple data sources - Support for Snowflake, BigQuery, Redshift, PostgreSQL
Advanced features
- Email alerts and reports - Automated dashboard delivery
- Dashboard embedding - Embed analytics in external applications
- Row-level security - Fine-grained access control
- Custom branding - Match your organization’s visual identity
Getting started
Ready to create your first dashboard? Here’s how to get started:Step 1: Set up your BI data connection
Before you can create dashboards, you need to configure a Business Intelligence app connection. This is essential because:- 5X BI requires a dedicated connection - BI needs its own app connection with specific permissions
- Choose your data source - Connect directly to your warehouse or use 5X’s Semantic Layer for unified metrics
- Secure access - BI connections use read-only permissions to protect your data while enabling analytics
Configure BI App Connection
Learn how to create a Business Intelligence app connection to access your data warehouse or semantic layer.
Core documentation
Explore the comprehensive guides and tutorials to master 5X Business Intelligence:Dashboard Creation
Build interactive dashboardsLearn how to create compelling dashboards with charts, filters, and interactive elements.
Chart Building
Create visualizationsMaster the art of building compelling charts and visualizations from your data.
Data Exploration
Explore your dataLearn how to explore datasets, write custom SQL, and understand your data structure.
App Connections
Connect to data sourcesConfigure Business Intelligence app connections to access your data warehouse.
Dashboard Embedding
Embed in applicationsIntegrate dashboards into your applications with secure embedding capabilities.
Streamlined administration
5X Business Intelligence removes complexity by:- Hiding database management from the BI interface
- Integrating user management with 5X platform users
- Simplifying deployment with managed infrastructure
- Providing unified support across all platform capabilities